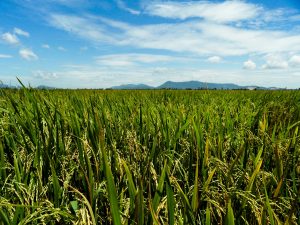
Rice is often produced in the lowest parts of the landscape. These are good places to grow rice because of the clayey soils and the relatively humid conditions because the groundwater is nearby.
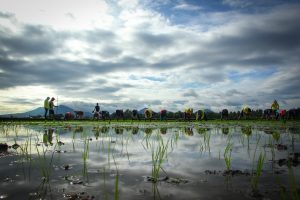
However, this low position, often in the floodplain of a river, makes the crop prone to flooding. If excessive water causes the crop to submerge, serious yield losses can occur. It has been estimated that, in Bangladesh and India alone, approximately 4 million tons of rice are lost every year. In South Asia, this is about equivalent to the amount annually consumed by 30 million people.
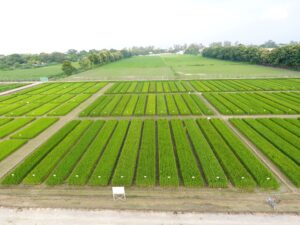
However, these estimates of production loss are rather uncertain because flooding is highly variable in time and space, and farmers have, in part, adjusted their cropping practices to expected flood occurrences. We would like to have a clearer understanding of where, when, and for how long flooding is likely to occur. This could help us understand where the benefits of submergence-tolerant varieties, which the International Rice Research Institute has developed (see Scuba rice), would be greatest, and where these varieties would most likely be adopted by farmers.
We use satellite remote sensing to map the area of rice production and the occurrence of flooding in Asia. We use freely available data from the Modis (Moderate-resolution Imaging Spectroradiometer) sensor.
This sensor is on board the Terra and Aqua satellites. These satellites create a daily record for each place on Earth at a spatial resolution (pixel size) of 250 to 1,000 m. Because of clouds, however, the rainy season can have many days when certain areas do not have values, but, generally, one can expect to get at least one good observation per week.
The Modis sensor records reflectance (the fraction of incoming radiant energy that is reflected from a surface of the Earth) in 36 different wavelengths across the electromagnetic spectrum—from the visible to the thermal infrared (0.4 μm to 14.4 μm). Water can be easily identified by combining reflectance in the red, near-infrared, and shortwave. Rice is identified using a combination of water and vegetation indices computed from the reflectance data.
The large map (see below) illustrates the results using the Modis data for identifying water. The lower left map shows surface water during 4-12 August 2007, when parts of eastern India and Bangladesh were affected by severe inundations.
The three small maps of northeastern Thailand show areas with water in three different years: 7-15 October 2002, 21-29 September 2004, and 15-23 October 2006.

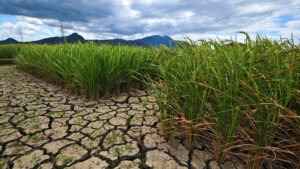
Identifying surface water is relatively simple. The challenge is to integrate it with data on rice planting and development to see where fields get submerged, and during which stage of crop development. We are also trying to identify areas where farmers delay planting until the risk of submergence has diminished.
The availability of free daily satellite images, and algorithms implemented in open-source software for geographic data analysis, such as GRASS and R, allows us to use satellite technology to map rice areas and some of the constraints that farmers have to deal with. In the future, we also plan to estimate yield loss caused by drought.
_________________________________________
Dr. Chemin is a postdoctoral fellow and Dr. Hijmans is a geographer in the IRRI Social Sciences Division.