- Researchers combined EO and AI deep learning with administrative and survey data to conduct impact evaluations when traditional economic data is missing.
- The analysis showed that stress-tolerant rice varieties improved production during floods of the ‘just right’ intensity and duration
- This methodology provides a new pathway for evaluating agricultural innovations in settings where conventional data collection was never conducted.
By Glenn Concepcion
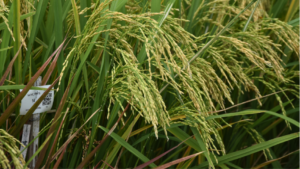
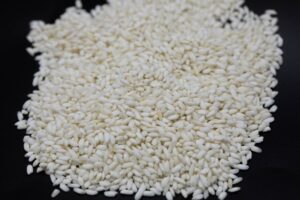
For the farmers of Bangladesh, the Aman rice season is a high-stakes gamble against nature. While the monsoon rains are essential for growth, extreme flooding can submerge and destroy entire harvests. To mitigate this risk, scientists introduced Stress-Tolerant Rice Varieties (STRVs), such as Swarna-Sub1, which carry a specific gene allowing the plant to survive underwater for up to two weeks. However, evaluating the success of these varieties, which were first released in 2010, has long been hampered by a lack of historical baseline data, leaving economists in a “data-scarce environment”.
A new study published in the Journal of Development Economics has found a way to look back in time. By combining Earth Observation (EO) data with Artificial Intelligence (AI) deep learning algorithms, the authors have developed a methodology to reconstruct decades of agricultural history, proving that these climate-resilient crops are indeed making a difference.
The problem of recency bias
Economists typically rely on baseline data, or information taken before a new technology is introduced, to measure impact. In many developing nations, such data is often missing or unreliable. While modern satellites now provide high-resolution imagery, the researchers point out a “recency bias” in this data; the most substantial improvements in satellite clarity and frequency only occurred after 2010. Because STRVs were first released in Bangladesh in 2010, no high-resolution satellite baseline exists to compare “before” and “after” conditions on a national scale.
Furthermore, traditional household surveys are often plagued by measurement errors. Farmers may struggle to retrospectively report the exact duration of a flood from a decade ago with the precision required to evaluate a technology that only works under specific submergence windows. This lack of precise historical data creates data-poor conditions that have traditionally made large-scale impact evaluations nearly impossible.
A time machine for agricultural data
To bridge this gap, a team of researchers from the University of Arizona, University of Idaho, the Massachusetts Institute of Technology, the International Rice Research Institute, and the University of Wisconsin-Madison utilized AI to infer the past from grainier, historical satellite records. Their approach involved two innovative AI-driven methodologies:
- First, to identify where rice was grown in Bangladesh every year since 2002, the team used a “human-in-the-loop” approach. They hand-annotated thousands of historical Google Earth images to create a training dataset. This data was then fed into a Random Forest algorithm, which learned to identify rice cultivation patterns across the country with 82% accuracy.
- The second challenge was mapping historical floods. Optical satellites are often blinded by the very clouds that cause flooding. To solve this, the researchers used modern radar data from Sentinel-1—a satellite launched in 2014 that can “see” through clouds—to train a sophisticated Convolutional Neural Network-Long Short-Term Memory (CNN-LSTM) model. This AI “learned” the dynamics of how floods move across the landscape in the modern era and then projected that knowledge backward to interpret lower-resolution historical data from the MODIS sensor. This model achieved an impressive 90% accuracy in reconstructing 20 years of flood history.
Solving the Goldilocks Problem
The study highlights a unique hurdle in agricultural science known as the “Goldilocks Problem”. STRVs are a stochastic technology, meaning their benefits only appear under specific circumstances. If there is no flood, the seeds perform like any other variety; if a flood is too deep or lasts more than 20 days, even the tolerant rice will perish. The technology is only effective when the flooding is “just right”, typically between 5 and 20 days of submergence.
By using AI to analyze over 600 different “flood windows,” the researchers identified the specific instances where these Goldilocks conditions were met. Their analysis involved running 1,880 different regressions to test various flood intensities and durations. They found that 15% of these coefficients were positive and significant, about three times the amount one would expect to find by random chance.
The findings confirmed that STRVs have a positive and significant impact on rice production, as measured by the Enhanced Vegetation Index (EVI), a satellite proxy for crop health. These gains were most evident during floods categorized between the 50th and 65th quantiles of intensity.
Overcoming data-poor conditions
The implications of this study reach far beyond the rice paddies of Bangladesh. By demonstrating that AI can infer the past with precision, the researchers are exploring the potential for evaluating dozens of other technologies, from anti-poverty programs to conservation efforts, that were previously thought to be unmeasurable due to a lack of baseline data.
While the past remains data poor, the fusion of deep learning and satellite imagery is rapidly overcoming that. As climate change makes agricultural outcomes more unpredictable, the ability to use AI to measure both historical and future impacts will be a vital tool in ensuring global food security. For the first time, researchers can look back with the same clarity they use to look forward, turning data-scarce environments into laboratories of discovery.
Read the study:
Jeffrey Michler, Dewan Abdullah Al Rafi, Jonathan Giezendanner, Anna Josephson, Valerien Pede, Elizabeth Tellman
Impact evaluations in data-scarce environments: The case of stress-tolerant rice varieties in Bangladesh
Journal of Development Economics, Volume 179 (2026)
https://doi.org/10.1016/j.jdeveco.2025.103648