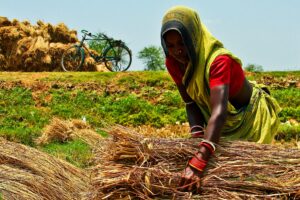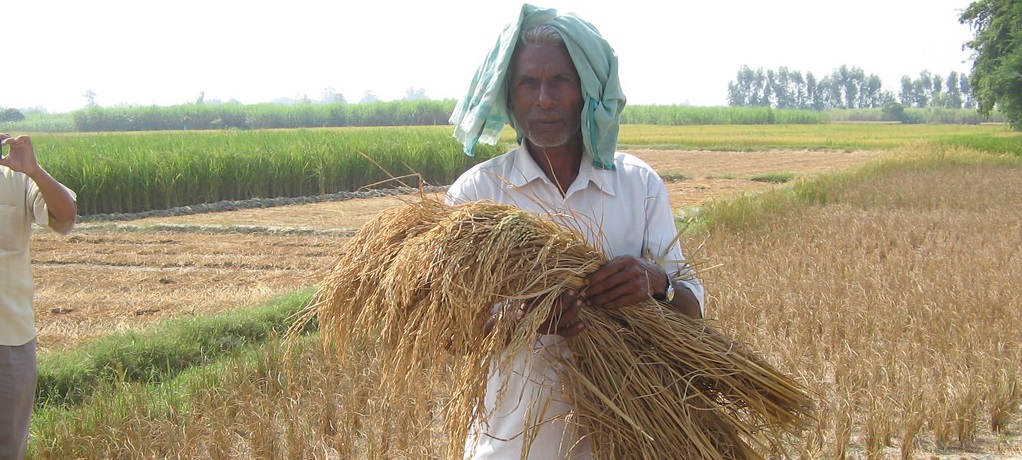
More than 65% of the 1.7 billion people in South Asia live in rural areas and rely...
Maps
Rice, cultivated in the flood plains along the Niger River and its tributaries in Nigeria’s northern states,...
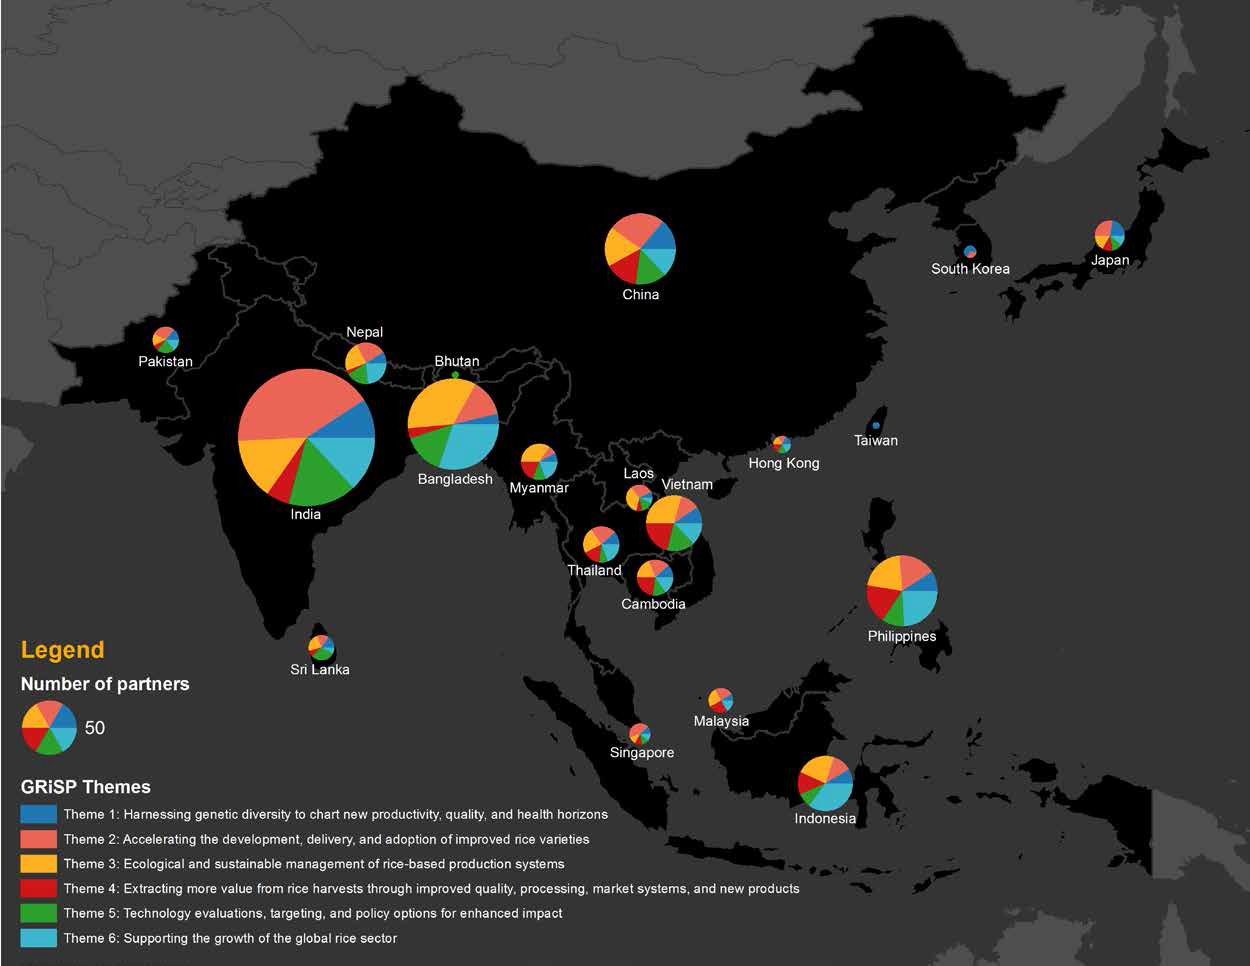
GRiSP brings together more than 900 partners globally to address the shared goal of reducing poverty and...

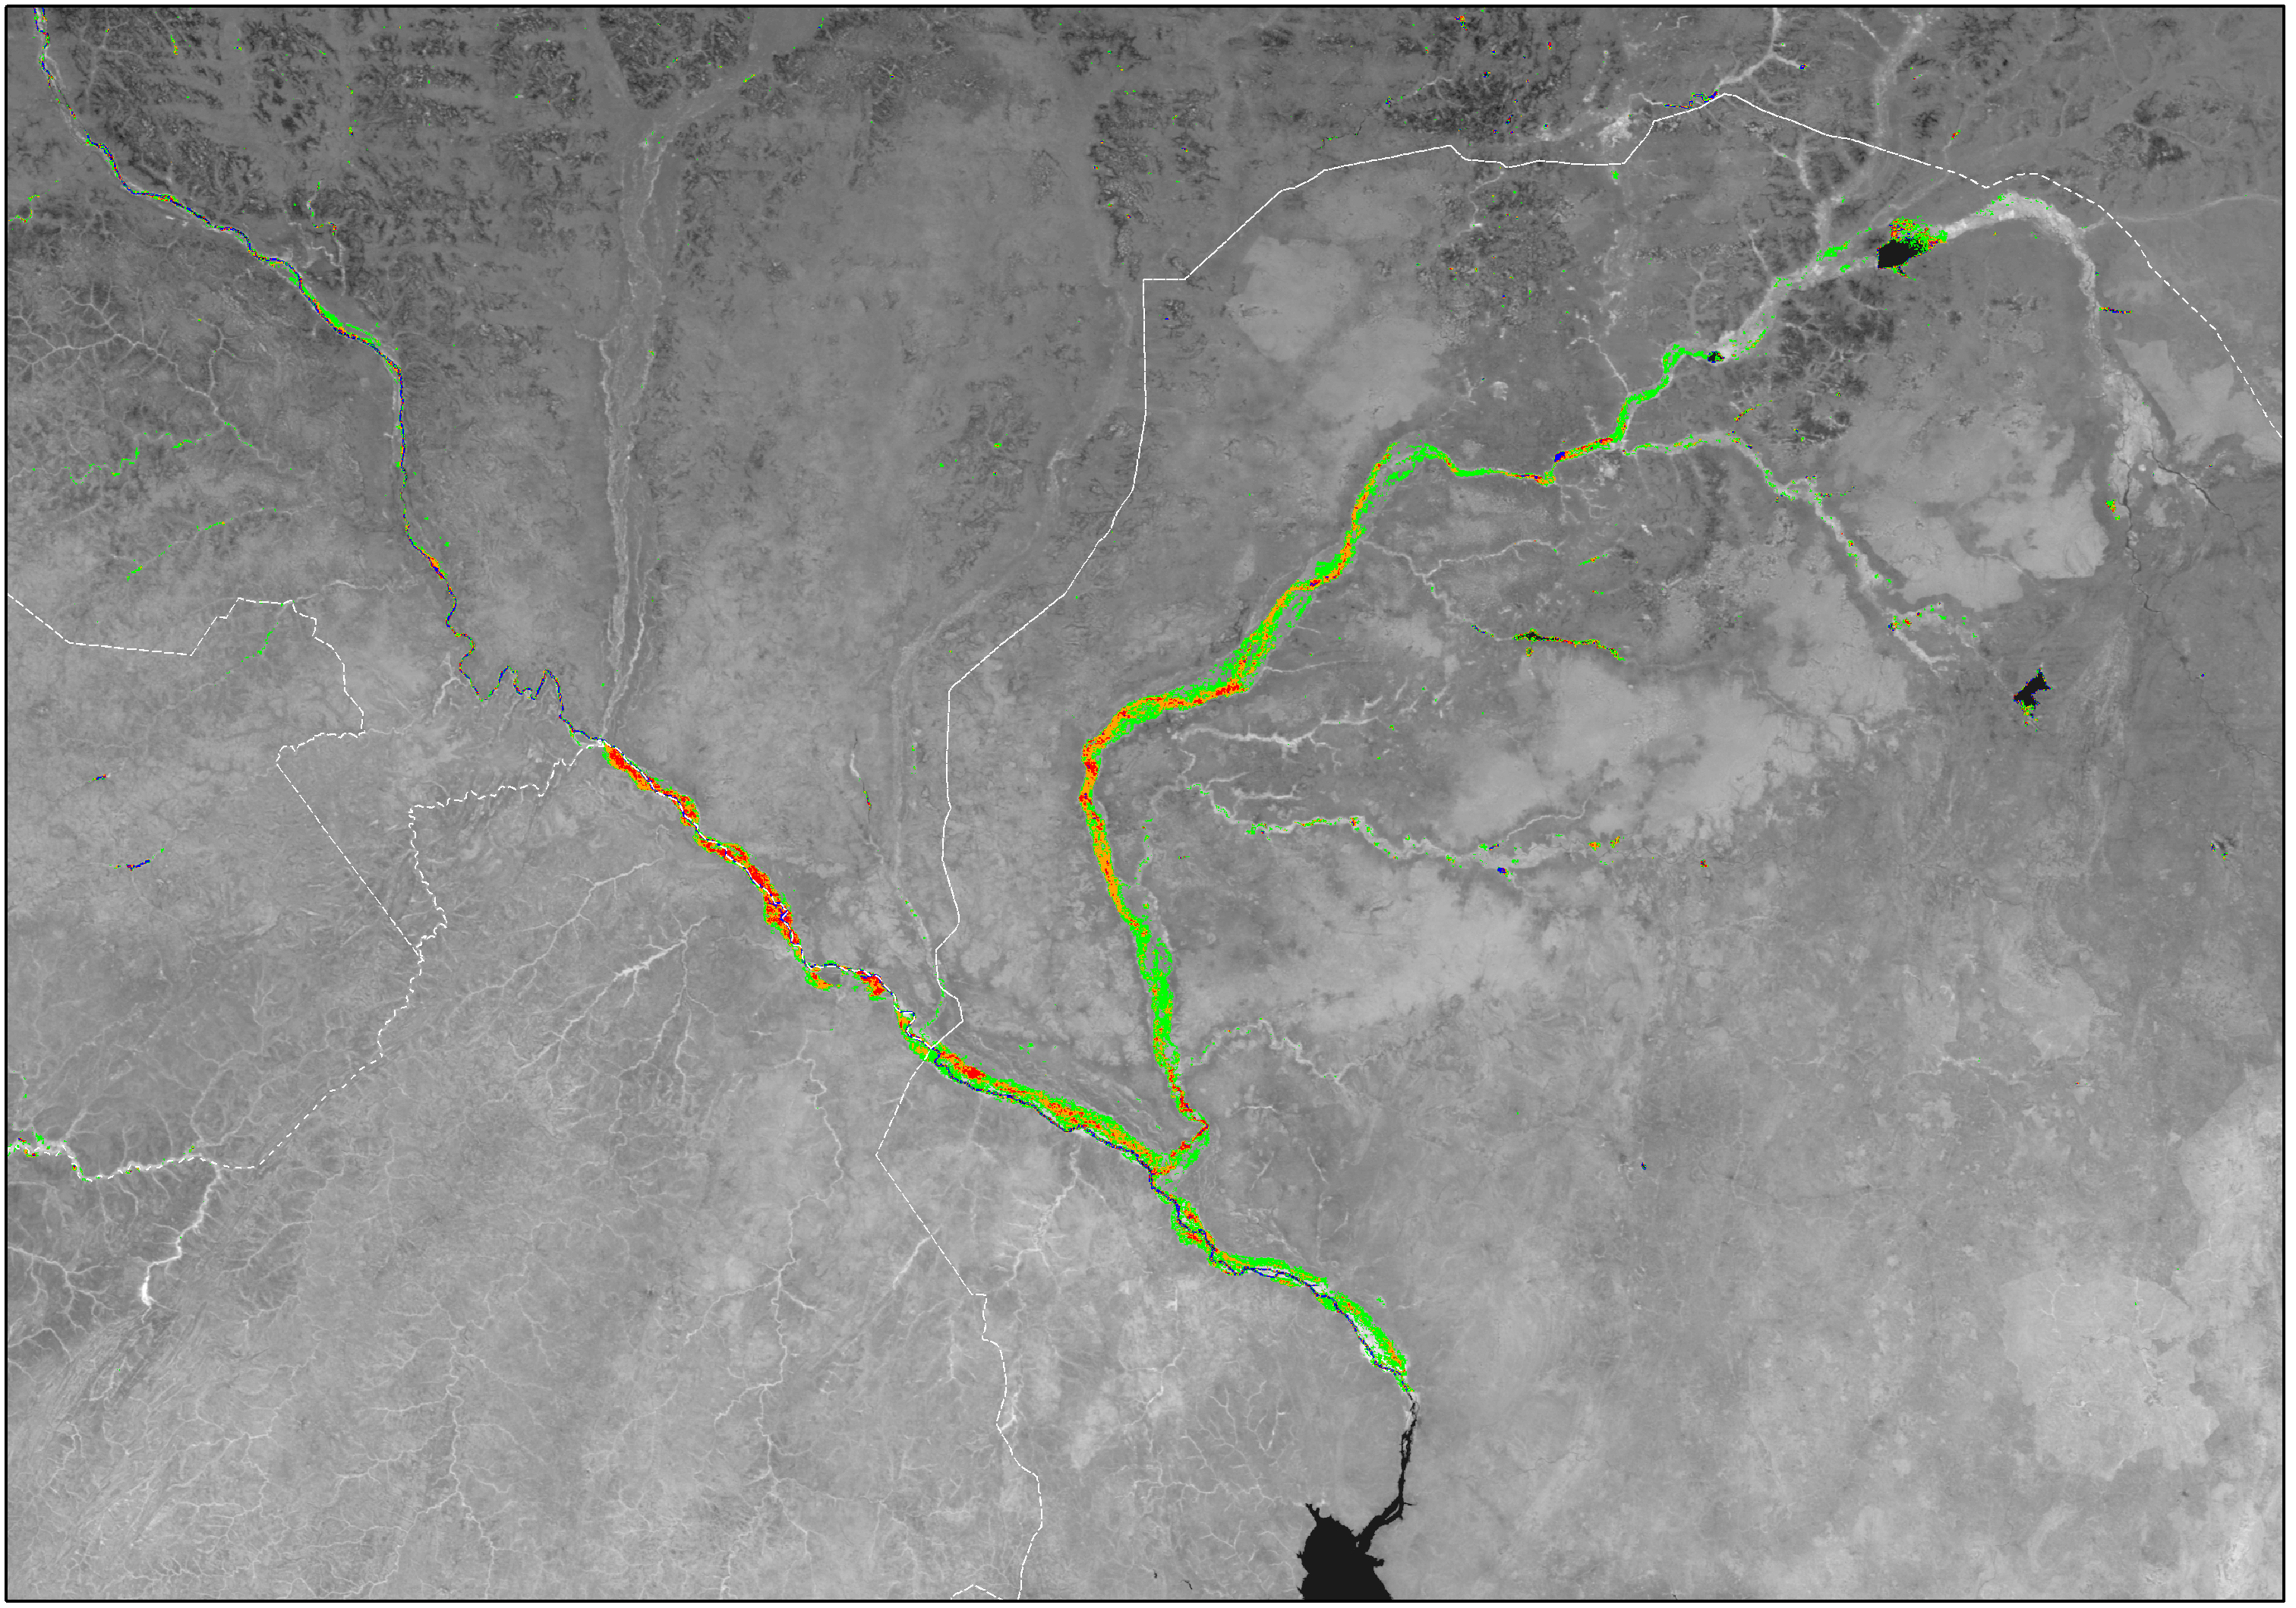
Sentinel-1A, a radar imaging satellite, is an important tool for rice mapping and monitoring. It can provide...
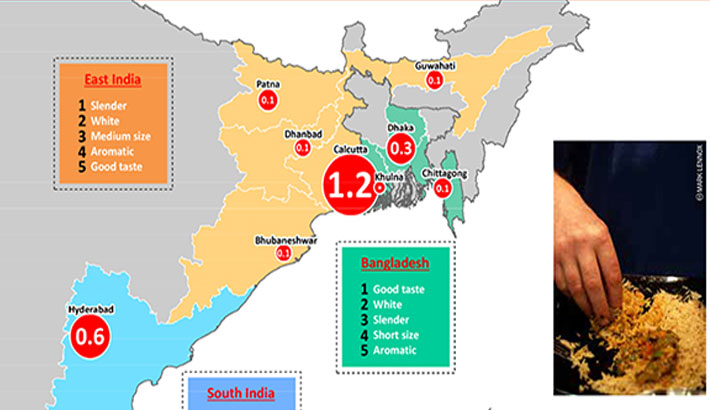
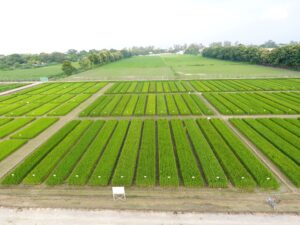
About a third of the world’s rice is produced and consumed in South Asia. By 2035, about...
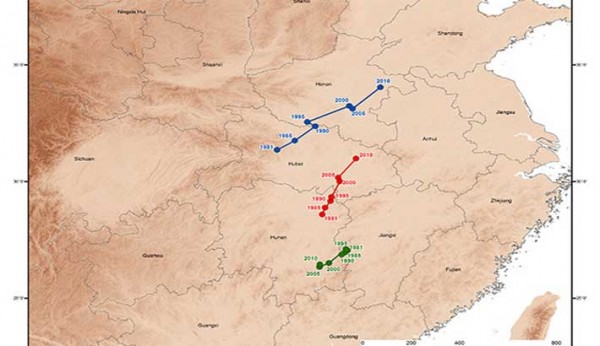
Understanding and visualizing trends in rice-producing countries is a major task of the Geographic Information Systems (GIS)...
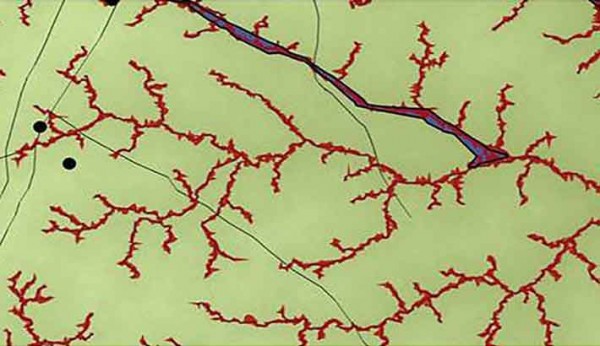
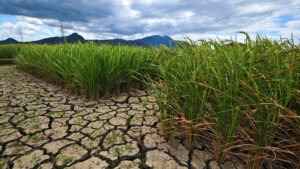
Inland valleys—common landscapes in Africa—can play a vital role in future food security because they are more...
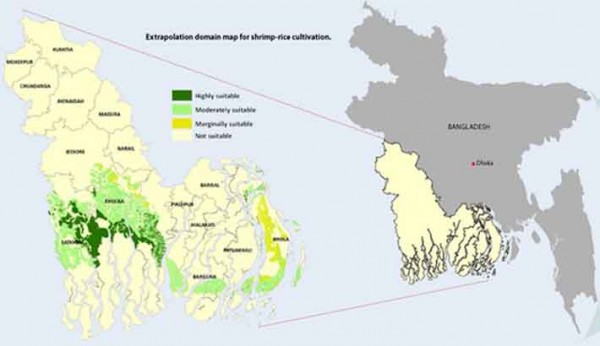
In the coastal polder zone of Bangladesh, satisfying food demand and improving the livelihoods of about 8...
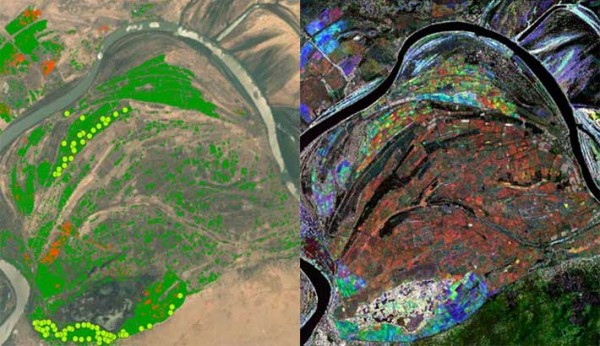
Remote sensing or satellite image interpretation is a promising alternative in getting information on where and how...

Satellite images showing flooded rice farms and buildings that were damaged by Typhoon Haiyan (local name Yolanda)...